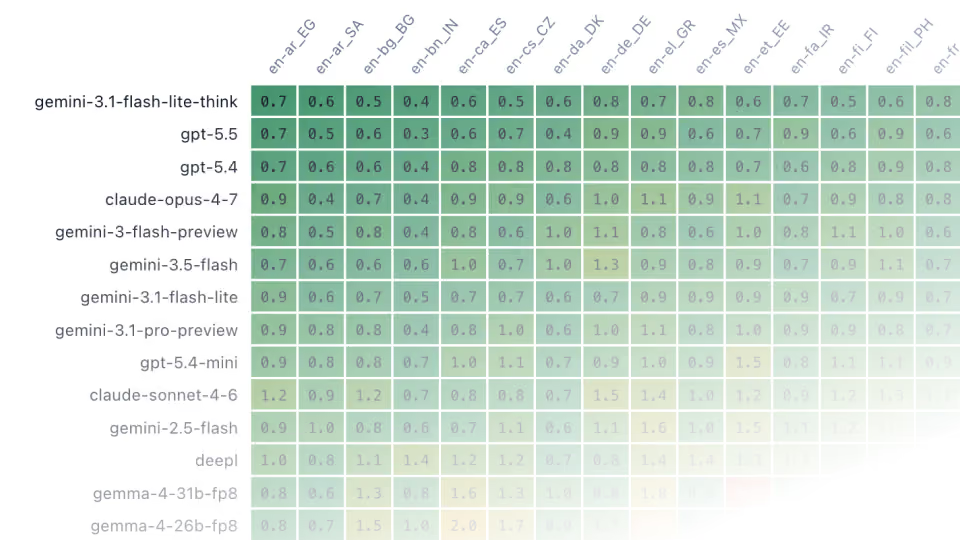
At SyncWords, we move live audio across language barriers in real time. Every second of broadcast, we're making decisions about which translation system to run — for which language pair, at what cost, with what tolerance for failure.
That means we can't rely on marketing decks or vendor-provided benchmarks. We need to know, with statistical confidence, which engine performs best for a specific language pair today.
So we built our own evaluation framework. And the methodology behind it is more nuanced than most people expect.
This post is the full technical picture.
_________________________
Get free access to te tool we use for comparing the machine translation engines
Why Off-the-Shelf Benchmarks Aren't Enough
The standard approach to MT evaluation is to pick a benchmark dataset, run your systems through it, and report a single score. Simple.
The problem is that single score hides almost everything that matters in production.
It doesn't tell you whether the system failed silently. It doesn't tell you whether the "accurate" output is accurate in standard language but wrong for your regional audience. It doesn't tell you what the system costs to run at real-time speech cadence. And it certainly doesn't tell you whether the number you're looking at is statistically distinguishable from the system ranked just below it.
We designed our framework — built on top of the WMT24++ dataset — to surface all of that. Here's how it works.
The Dataset: WMT24++
WMT24++ is a post-edited parallel corpus covering 55 language pairs (English → target), with 960 segments per pair. The references are human post-edits — not machine-generated, not raw translations — which makes them a reliable quality anchor.
Every system we evaluate translates all 960 segments for every language pair it supports. That gives us 960 data points per (system, language pair) cell — enough to compute tight confidence intervals and catch per-segment failure patterns.
Two Metrics, Not One
The core of our evaluation is two independent quality signals used together. Neither is sufficient alone.
MetricX24 (Reference-Based)
MetricX-24-Hybrid-XL is Google Research's learned MT quality metric — an mT5 model with approximately 3.7 billion parameters, trained to regress a quality score from (source, hypothesis, reference) triples. It's one of the best-performing reference-based metrics available, and it correlates well with human judgments in controlled settings.
But it has a known bias we account for explicitly: it rewards "neutral standard" outputs over regionally authentic translations.
In practice this means MetricX will systematically penalize a system that correctly produces Egyptian Arabic dialect over Modern Standard Arabic, Quebec French over Parisian French, or Mexican Spanish over Castilian. The metric was trained predominantly on "standard" language references, and it reflects that.
For a company operating in markets like LATAM, US Hispanic, and the Middle East — where dialectal accuracy is the difference between content that lands and content that sounds foreign — this bias isn't a footnote. It's a fundamental problem with trusting a single metric.
MetricX is still valuable. It's a precise, reproducible signal. But it needs a corrective second opinion.
GEMBA-MQM (LLM-as-Judge)
GEMBA-MQM provides that second opinion. Instead of comparing against a reference translation, it asks a frontier language model to annotate errors directly using the MQM (Multidimensional Quality Metrics) taxonomy.
The judge is shown (source, reference, candidate) and asked to identify errors across six dimensions: accuracy/mistranslation, fluency/grammar, style, locale/format, and terminology — each at one of three severity levels.
The segment score is the WMT-standard severity-weighted sum, capped at 25:
score = min(25, Σ severity_weight(e))
Where minor = 1, major = 5, critical = 25.
Two design choices make this reliable in practice.
First, reasoning is enabled for all judges. Without chain-of-thought reasoning, LLM judges hallucinate errors — they produce confident scores with no basis in the actual translation. With reasoning enabled (thinking_budget=-1 dynamic for Gemini, reasoning_effort=medium for GPT), the judges produce annotation that's coherent and auditable.
Second, the prompt explicitly instructs judges to treat regional and dialectal variants as valid translations. This directly addresses MetricX's standard-language bias. A system that produces correct Egyptian Arabic dialect should not be penalized for it — and under GEMBA's prompt design, it isn't.
We currently run multiple judges simultaneously. Each writes to its own results directory; the report auto-discovers all judges and renders one column per judge. Strong agreement across judges is high-confidence signal. Disagreement between judges marks the places where the metric itself is uncertain — which is itself useful information.
What is the GEMBA Rate? The GEMBA Rate (shown as GEMBA Combined in the tool) is the average score across all active judges for a given (system, language pair) cell. It's the headline GEMBA number — the single figure to look at when you want a quick read on translation quality. Individual judge columns (e.g. GEMBA Gemini-3.1-Flash-Lite, GEMBA GPT-5.4-Mini) sit alongside it so you can see where judges agree and where they diverge. When the combined rate is low and the individual judges are close to each other, you have a high-confidence quality signal. When judges diverge significantly, treat the combined rate as directional only and inspect the per-judge columns.
Reading the Two Together
The right way to interpret MetricX and GEMBA side by side is: MetricX tells you how close the output is to a standard reference. GEMBA tells you whether a qualified reader would actually find errors in it.
When they agree — strong on both — you have a reliable signal. When MetricX scores a system lower than GEMBA, you're likely looking at a regionally authentic output that MetricX penalizes. When GEMBA scores worse than MetricX, the output may be technically close to the reference but contains real fluency or accuracy issues a human would catch.
Both scores are on the same 0–25 scale. Lower is better on both.
Confidence Intervals
Every cell in the report shows mean ± half-width of a 95% bootstrap confidence interval on the segment mean.
This matters more than most evaluation reports acknowledge. With 960 segments, system-wide CIs are typically tight — around ±0.02. Per-language-pair CIs are wider — around ±0.10 — but still meaningful.
The practical implication: when two systems' confidence intervals overlap, they are statistically tied. Ranking one above the other is not defensible. The report reflects this — we don't claim a winner where the data doesn't support one.
Cost: What It Actually Costs to Run at Speech Rate
The $/hr figure in our report is not an API pricing table. It's an estimate of what it costs to run each system as a single real-time translation stream against a human speaker.
We use ~750 characters per minute as the baseline — average English speech cadence. The fastest production stream we've seen runs at ~1,200 cpm; costs scale linearly.
For LLM systems, cost is calculated per-token based on the production prompt plus a 7-piece accumulated context window, with no prompt-cache discount assumed (conservative estimate). For NMT systems — DeepL, Google Translate, Amazon Translate — cost is calculated per-character against contracted or public rates.
One important note: paragraph-mode systems display the sentence-mode cost estimate, because production never runs in paragraph mode. A paragraph-mode cost estimate would be artificially low and misleading for real deployment decisions.
Failure Classification
This is the part most benchmarks ignore entirely.
A bad translation gets a high score. A catastrophic failure — a system that refused to translate, looped infinitely, or silently returned nothing — gets recorded as a zero, which distorts averages and hides the real risk.
We tag every segment with one or more failure flags. A segment is "failed" if any flag fires. Bad-but-not-broken translations are not flagged — they show up as high scores in MetricX and GEMBA.
API-level failures are the most operationally significant:
stuck— degenerate decoding loop. The model emits the same token repeatedly, usually triggered by source text with repeated characters (noooooOOOOoo,waaaaahoooo!!). Raising the token budget produces more loop tokens, not a better translation, so we cap and flag.refused— the model declined to translate. Covers Gemini's anti-memorization filter (RECITATION), safety filters, and content blocklists. The segment is permanently inaccessible to this system.api_error— infrastructure failures: non-429 4xx errors, gRPC timeouts after retry exhaustion. The category to watch if you're asking "is the integration broken?"empty— API call succeeded, model returned a blank string. Distinct from the above failures.
Output-structure failures catch models that technically returned something, but not a translation:
untranslated— hypothesis equals source. We skip short segments, heavily non-alphabetic text, and content that's legitimately untranslatable (hashtags, URLs, @mentions).markdown_fence— model wrapped output in code blocks despite explicit instruction not to.preamble— output starts with"Translation:","Here's the translation", or locale equivalents. Model didn't follow the output format.reasoning_leak— model exposed its internal chain-of-thought in the output. Indicates a misconfigured hybrid reasoning model.multiple_alternatives— model offered options instead of a single translation.translator_note— trailing parenthetical added by the model.
The failure rate column in the report aggregates all of these. A system with a 0% failure rate on your target language pair is meaningfully different from one at 2–3%, especially in live broadcast where a failed segment means silence or garbage on air.
What This Means for Production Decisions
The reason we built this evaluation framework — and the reason we're making it publicly available — is that translation engine selection is not a one-time decision.
Model capabilities change. New versions ship. Pricing structures shift. Language-pair coverage expands. A system that was the right choice for English → Spanish six months ago may not be today.
We run this evaluation continuously. The tool reflects current performance, not archived benchmarks.
For broadcasters and streaming services operating in multilingual markets, the operational stakes are real: the wrong engine for a language pair means lower quality output, higher cost, or higher failure risk on live content. Getting it right requires data, not assumptions.
That's what this framework is built to provide.
The MT engine comparison tool is free. Request access at syncwords.com or reach out directly — we're happy to walk through what the data shows for your specific language pairs.